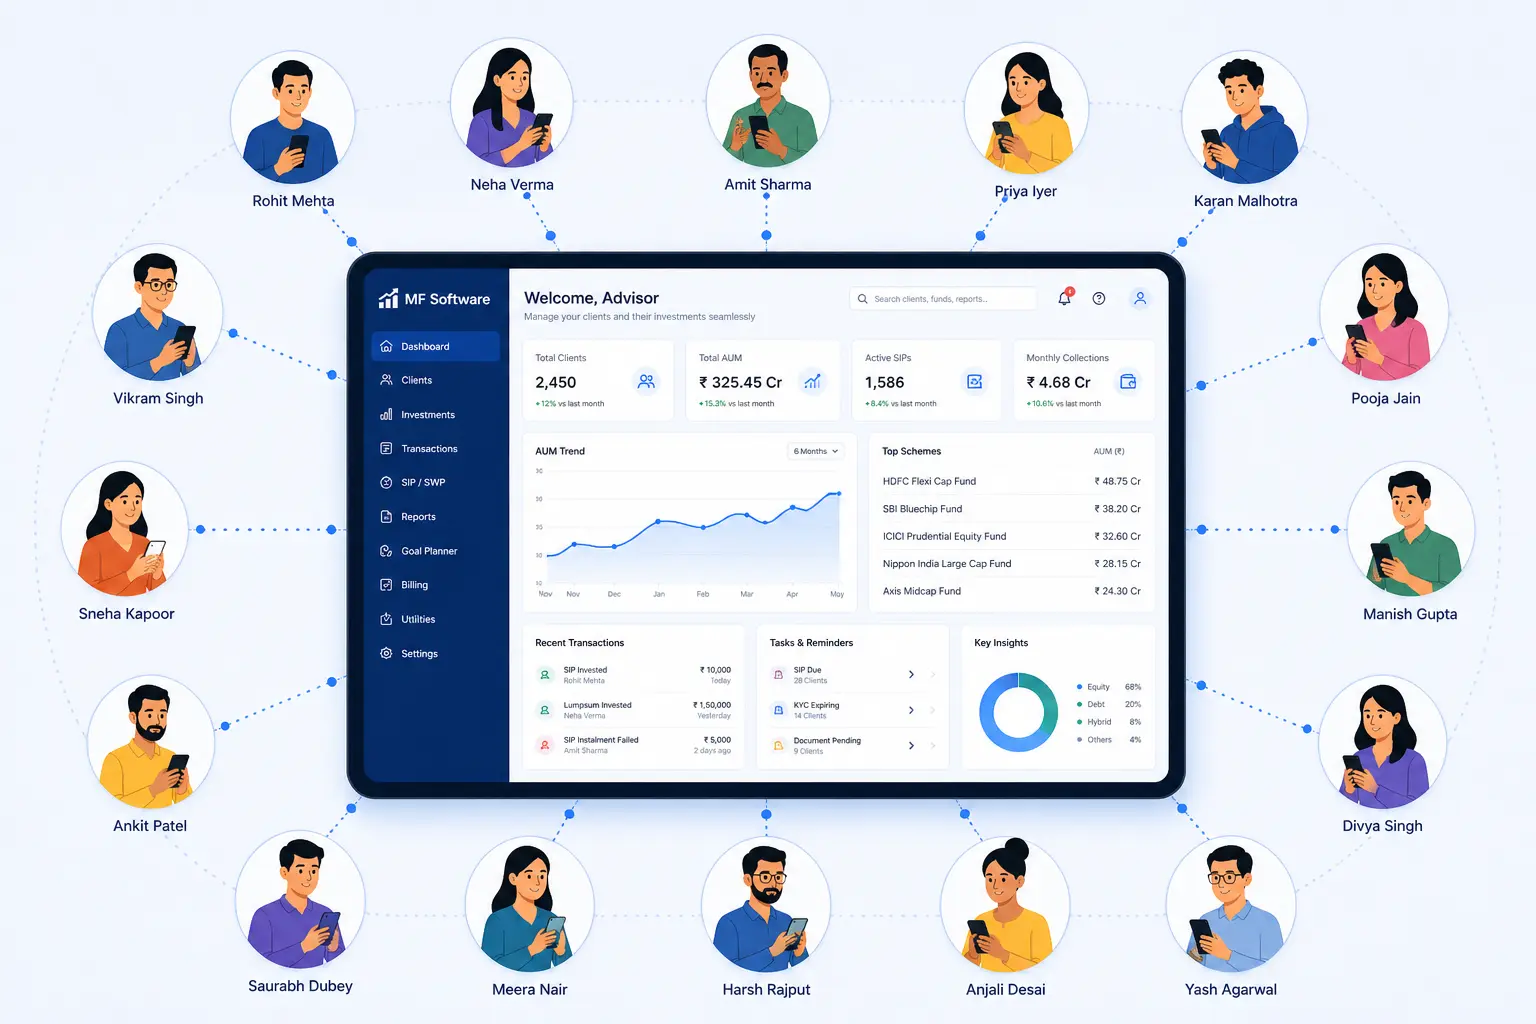
If you manage 1,000+ clients, you already know how difficult it is to track every scheme properly.
Each client has multiple funds.
Each fund has a benchmark.
Each benchmark has different performance numbers.
Now try comparing all of that manually across 3 months, 1 year, 3 years, and 5 years. It’s simply not practical. And this matters more than ever.
According to Ace Mutual Funds data, more than 53% of equity mutual funds underperformed their benchmarks over a 5-year period. That means many funds are not beating the index they are supposed to outperform.
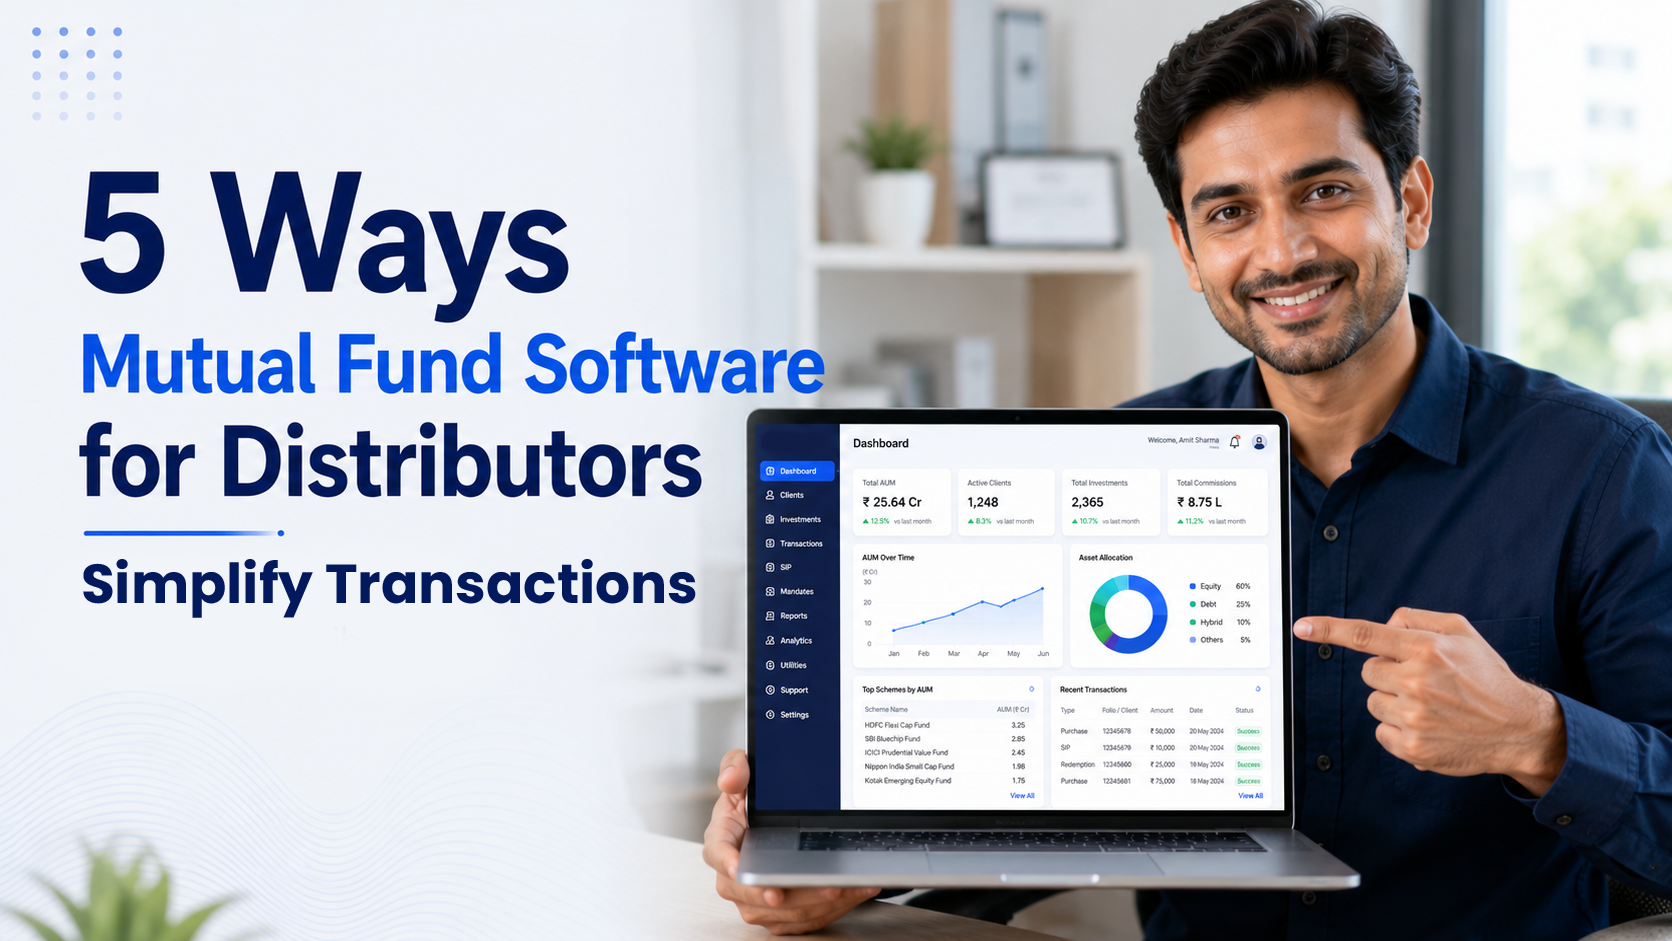
So the real question becomes: How do you track this at scale? That’s where the Scheme vs Benchmark Performance Report inside mutual fund software for distributors becomes extremely useful.
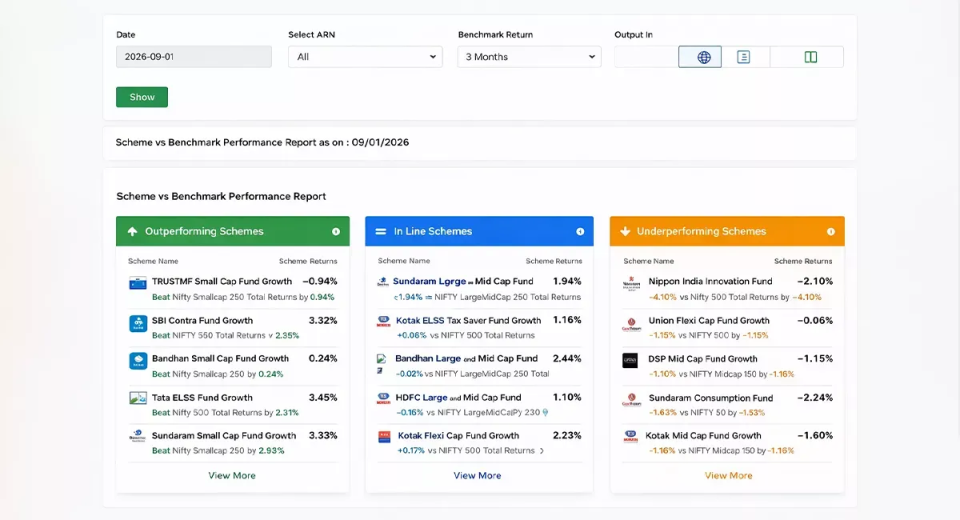
What Is the Scheme vs Benchmark Performance Report?
It is a report that shows:
● Scheme return
● Benchmark return
● The difference between the two
All in one place. Instead of checking fact sheets and index data separately, the software shows both numbers side by side.
It clearly tells you whether the fund is:
● Outperforming
● In line
● Underperforming
This makes performance review faster and more structured.
What Does This Report Show?
The report in mutual fund software for IFA provides comparison across:
● 3 Months
● 6 Months
● 1 Year
● 3 Years
● 5 Years
For each period, you see:
Scheme Return
How much the fund has delivered.
Benchmark Return
How much the benchmark index delivered during the same period.
Return Difference
The gap between fund and benchmark.
Performance Status
A simple tag showing whether the scheme is beating the benchmark or not.
Everything is shown in one clean view.
What is a Benchmark?
Not that you already don't know, but a benchmark is a market index used to measure how well a mutual fund is performing.
It acts as a comparison standard. If a fund is actively managed, it is expected to perform better than its benchmark over time.
Different types of schemes have different benchmarks because they invest in different market segments.
For example:
● Large-cap equity funds are usually compared to indices like Nifty 50 or Sensex.
● Mid-cap funds are benchmarked against mid-cap indices.
● Multi-cap or flexi-cap funds may track broader indices like Nifty 500.
● Debt funds are compared to bond or fixed income indices.
● Hybrid funds may use a mix of equity and debt benchmarks.
This ensures that performance comparison is fair and relevant. A debt fund should not be compared with an equity index, and a mid-cap fund should not be compared with a large-cap index.
That is why benchmark comparison matters — it tells you whether the fund is actually adding value within its category.
Why Manual Tracking Becomes a Problem
Let’s look at numbers. If you manage:
● 1,200 clients
● Average 4–5 schemes per client
That’s around 5,000–6,000 scheme instances. Now compare each scheme across 5 time periods.
You are looking at 25,000+ comparisons. Doing this manually using Excel or separate fact sheets is time-consuming and easy to miss. As business grows, manual systems start breaking down.
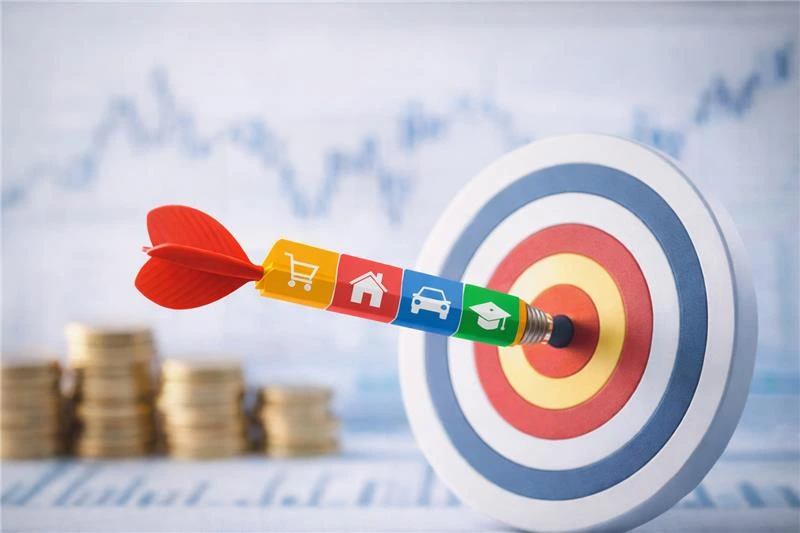
Why Benchmark Comparison Is Important
Many times, we look at only fund returns. For example:
If a fund gives 12%, it sounds good.
But what if its benchmark gave 15%?
That means the fund is 3% behind the market.
Over 5 years, even a small difference like 2–3% every year makes a big impact on final wealth.
If underperformance continues and is not noticed early, it can affect:
● Portfolio quality
● Client confidence
● Long-term AUM
Why Multi-Year Comparison Matters
Sometimes a scheme may:
● Perform well in 1 year
● Underperform in 3 years
● Lag badly over 5 years
If you only look at short-term numbers, you may miss the bigger trend. Seeing all time periods together helps you understand: Is the performance consistent?
Is underperformance temporary or long-term? This improves decision-making.
How This Report Helps You Practically
With this report inside wealth management software, you can:
● Review many schemes at once
● Identify underperforming funds quickly
● Prepare better for review meetings
● Take timely rebalancing decisions
● Avoid surprises in client discussions
Instead of manually checking each scheme, you get a ready comparison dashboard. It saves time and improves clarity.
How This Protects Your AUM
When you track performance regularly:
● You catch issues early
● You take corrective action before clients ask
● You show structured monitoring
Clients feel more confident when they see that performance is being tracked properly. This helps in:
● Retention
● Higher SIP contributions
● Long-term trust
Why This is Important Today
With more than half of equity funds underperforming their benchmarks over 5 years, relying only on returns shown in marketing materials is risky.
Benchmark comparison helps you:
● Stay objective
● Maintain discipline
● Improve portfolio quality
● Strengthen advisory credibility
It turns performance review into a structured process, not a guess.
Final Thoughts
As your practice grows, manual tracking becomes difficult. The Scheme vs Benchmark Performance Report inside your software allows you to compare scheme vs benchmark easily, track underperformance across multiple years, and maintain better control over portfolios.